Prints and saves CFA fit, as well as plots CFA factor loadings, simultaneously.
Usage
cfa_fit_plot(
  model,
  data,
  covs = FALSE,
  estimator = "MLR",
  remove.items = "",
  print = TRUE,
  save.as.pdf = FALSE,
  file.name,
  ...
)
Arguments
- model
CFA model to fit.
- data
Data set on which to fit the CFA model.
- covs
Logical, whether to include covariances on the lavaan plot.
- estimator
What estimator to use for the CFA.
- remove.items
Optional, if one wants to remove items from the CFA model without having to redefine it completely again.
Logical, whether to print model summary to console.
- save.as.pdf
Logical, whether to save as PDF for a high-resolution, scalable vector graphic quality plot. Defaults to saving to the "/model" subfolder of the working directory. If it doesn't exist, it creates it. Then automatically open the created PDF in the default browser. Defaults to false.
- file.name
Optional (when
save.as.pdfis set toTRUE), if one wants something different than the default file name. It saves to pdf per default, so the .pdf extension should not be specified as it will add it automatically.- ...
Arguments to be passed to function lavaan::cfa.
Value
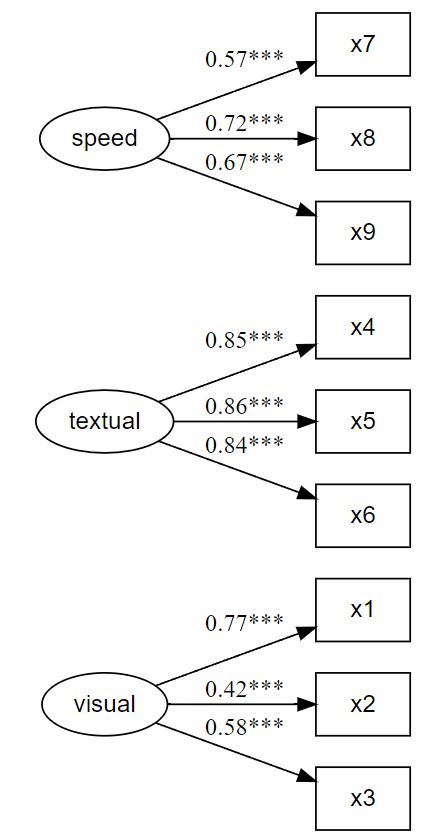
The function returns a lavaan fit object. However, it also: prints
a summary of the lavaan fit object to the console, and; prints a
lavaanPlot of the lavaan fit object.
Examples
x <- paste0("x", 1:9)
(latent <- list(
  visual = x[1:3],
  textual = x[4:6],
  speed = x[7:9]
))
#> $visual
#> [1] "x1" "x2" "x3"
#>
#> $textual
#> [1] "x4" "x5" "x6"
#>
#> $speed
#> [1] "x7" "x8" "x9"
#>

HS.model <- write_lavaan(latent = latent)
cat(HS.model)
#> ##################################################
#> # [-----Latent variables (measurement model)-----]
#>
#> visual =~ x1 + x2 + x3
#> textual =~ x4 + x5 + x6
#> speed =~ x7 + x8 + x9
#>

library(lavaan)
#> This is lavaan 0.6-20
#> lavaan is FREE software! Please report any bugs.
fit <- cfa_fit_plot(HS.model, HolzingerSwineford1939)
#> lavaan 0.6-20 ended normally after 35 iterations
#>
#>   Estimator                                         ML
#>   Optimization method                           NLMINB
#>   Number of model parameters                        21
#>
#>   Number of observations                           301
#>
#> Model Test User Model:
#>                                               Standard      Scaled
#>   Test Statistic                                85.306      87.132
#>   Degrees of freedom                                24          24
#>   P-value (Chi-square)                           0.000       0.000
#>   Scaling correction factor                                  0.979
#>     Yuan-Bentler correction (Mplus variant)
#>
#> Model Test Baseline Model:
#>
#>   Test statistic                               918.852     880.082
#>   Degrees of freedom                                36          36
#>   P-value                                        0.000       0.000
#>   Scaling correction factor                                  1.044
#>
#> User Model versus Baseline Model:
#>
#>   Comparative Fit Index (CFI)                    0.931       0.925
#>   Tucker-Lewis Index (TLI)                       0.896       0.888
#>
#>   Robust Comparative Fit Index (CFI)                         0.930
#>   Robust Tucker-Lewis Index (TLI)                            0.895
#>
#> Loglikelihood and Information Criteria:
#>
#>   Loglikelihood user model (H0)              -3737.745   -3737.745
#>   Scaling correction factor                                  1.133
#>       for the MLR correction
#>   Loglikelihood unrestricted model (H1)      -3695.092   -3695.092
#>   Scaling correction factor                                  1.051
#>       for the MLR correction
#>
#>   Akaike (AIC)                                7517.490    7517.490
#>   Bayesian (BIC)                              7595.339    7595.339
#>   Sample-size adjusted Bayesian (SABIC)       7528.739    7528.739
#>
#> Root Mean Square Error of Approximation:
#>
#>   RMSEA                                          0.092       0.093
#>   90 Percent confidence interval - lower         0.071       0.073
#>   90 Percent confidence interval - upper         0.114       0.115
#>   P-value H_0: RMSEA <= 0.050                    0.001       0.001
#>   P-value H_0: RMSEA >= 0.080                    0.840       0.862
#>
#>   Robust RMSEA                                               0.092
#>   90 Percent confidence interval - lower                     0.072
#>   90 Percent confidence interval - upper                     0.114
#>   P-value H_0: Robust RMSEA <= 0.050                         0.001
#>   P-value H_0: Robust RMSEA >= 0.080                         0.849
#>
#> Standardized Root Mean Square Residual:
#>
#>   SRMR                                           0.065       0.065
#>
#> Parameter Estimates:
#>
#>   Standard errors                             Sandwich
#>   Information bread                           Observed
#>   Observed information based on                Hessian
#>
#> Latent Variables:
#>                    Estimate  Std.Err  z-value  P(>|z|)   Std.lv  Std.all
#>   visual =~
#>     x1                1.000                               0.900    0.772
#>     x2                0.554    0.132    4.191    0.000    0.498    0.424
#>     x3                0.729    0.141    5.170    0.000    0.656    0.581
#>   textual =~
#>     x4                1.000                               0.990    0.852
#>     x5                1.113    0.066   16.946    0.000    1.102    0.855
#>     x6                0.926    0.061   15.089    0.000    0.917    0.838
#>   speed =~
#>     x7                1.000                               0.619    0.570
#>     x8                1.180    0.130    9.046    0.000    0.731    0.723
#>     x9                1.082    0.266    4.060    0.000    0.670    0.665
#>
#> Covariances:
#>                    Estimate  Std.Err  z-value  P(>|z|)   Std.lv  Std.all
#>   visual ~~
#>     textual           0.408    0.099    4.110    0.000    0.459    0.459
#>     speed             0.262    0.060    4.366    0.000    0.471    0.471
#>   textual ~~
#>     speed             0.173    0.056    3.081    0.002    0.283    0.283
#>
#> Variances:
#>                    Estimate  Std.Err  z-value  P(>|z|)   Std.lv  Std.all
#>    .x1                0.549    0.156    3.509    0.000    0.549    0.404
#>    .x2                1.134    0.112   10.135    0.000    1.134    0.821
#>    .x3                0.844    0.100    8.419    0.000    0.844    0.662
#>    .x4                0.371    0.050    7.382    0.000    0.371    0.275
#>    .x5                0.446    0.057    7.870    0.000    0.446    0.269
#>    .x6                0.356    0.047    7.658    0.000    0.356    0.298
#>    .x7                0.799    0.097    8.222    0.000    0.799    0.676
#>    .x8                0.488    0.120    4.080    0.000    0.488    0.477
#>    .x9                0.566    0.119    4.768    0.000    0.566    0.558
#>     visual            0.809    0.180    4.486    0.000    1.000    1.000
#>     textual           0.979    0.121    8.075    0.000    1.000    1.000
#>     speed             0.384    0.107    3.596    0.000    1.000    1.000
#>
#> R-Square:
#>                    Estimate
#>     x1                0.596
#>     x2                0.179
#>     x3                0.338
#>     x4                0.725
#>     x5                0.731
#>     x6                0.702
#>     x7                0.324
#>     x8                0.523
#>     x9                0.442
#>